Trending vs Ranging Markets: How to Tell the Difference
Before choosing an entry method, indicator, or confirmation technique, it helps to answer a more basic question: what kind of market environment are you looking at?
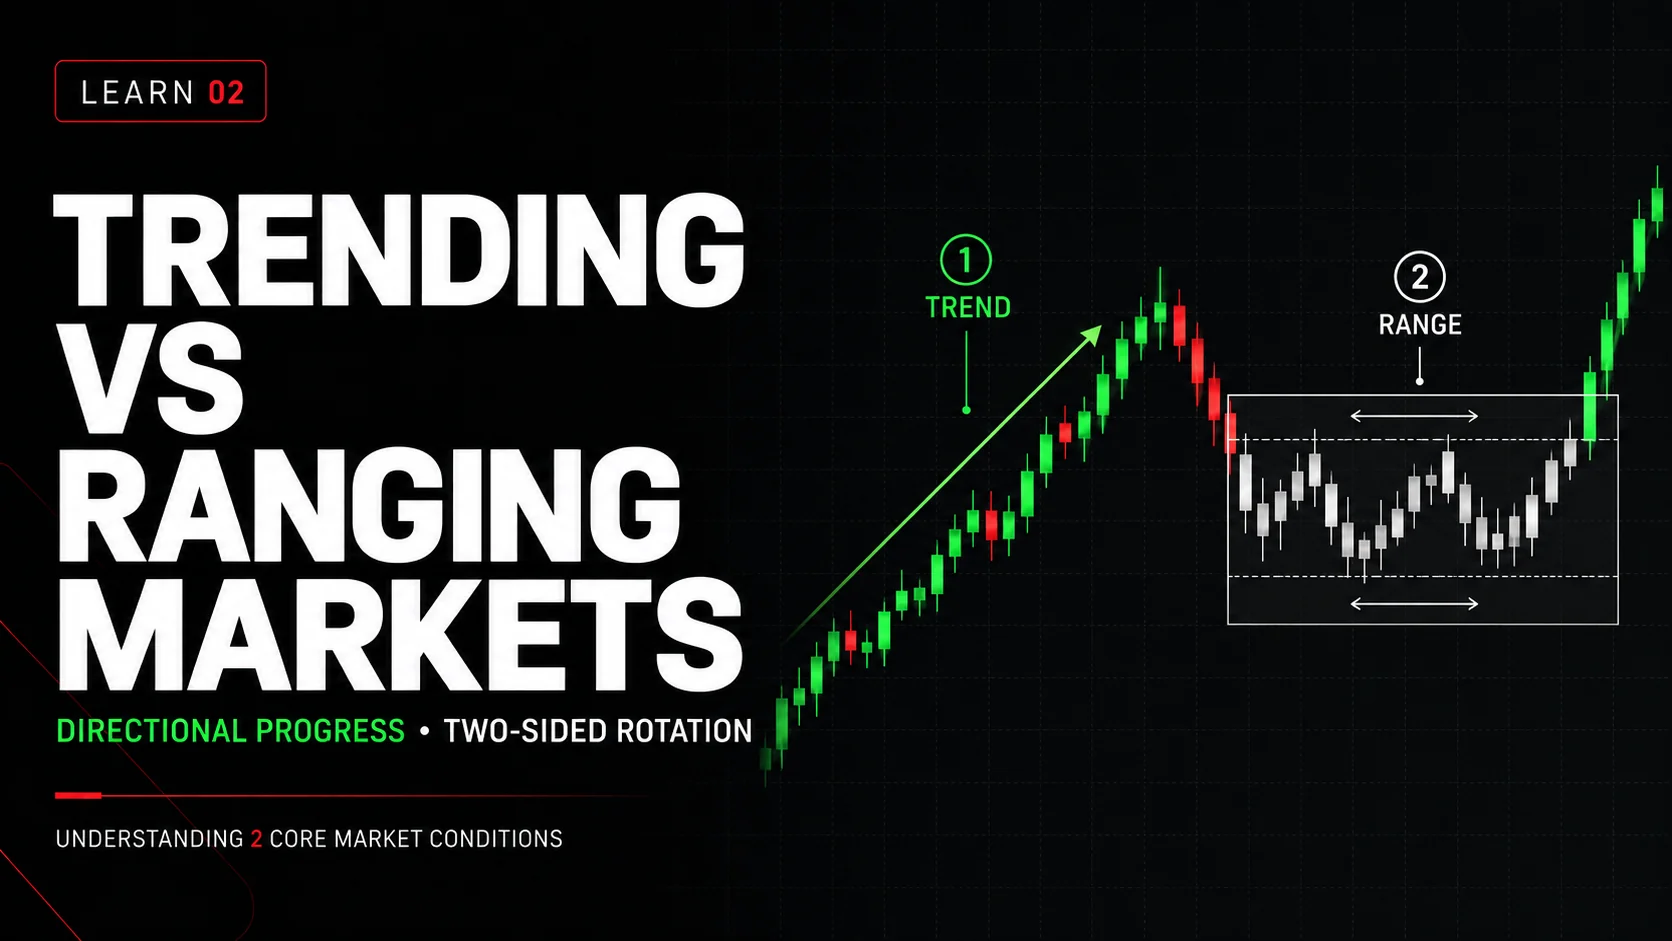
Price does not behave the same way at all times.
Sometimes the market makes sustained directional progress, repeatedly building structure in one direction.
At other times, price moves back and forth through the same general area, with neither side maintaining control for long.
These two broad conditions are commonly described as:
- Trending markets
- Ranging markets
Understanding the difference matters because the same price pattern can behave very differently depending on the surrounding market condition.
A setup that appears effective during directional expansion may produce repeated failures inside a range.
Likewise, a mean-reversion idea that works during two-sided rotation may behave very differently when price begins trending aggressively.
The objective is therefore not to label every chart perfectly.
The objective is to recognize whether price is currently producing directional progress or two-sided rotation.
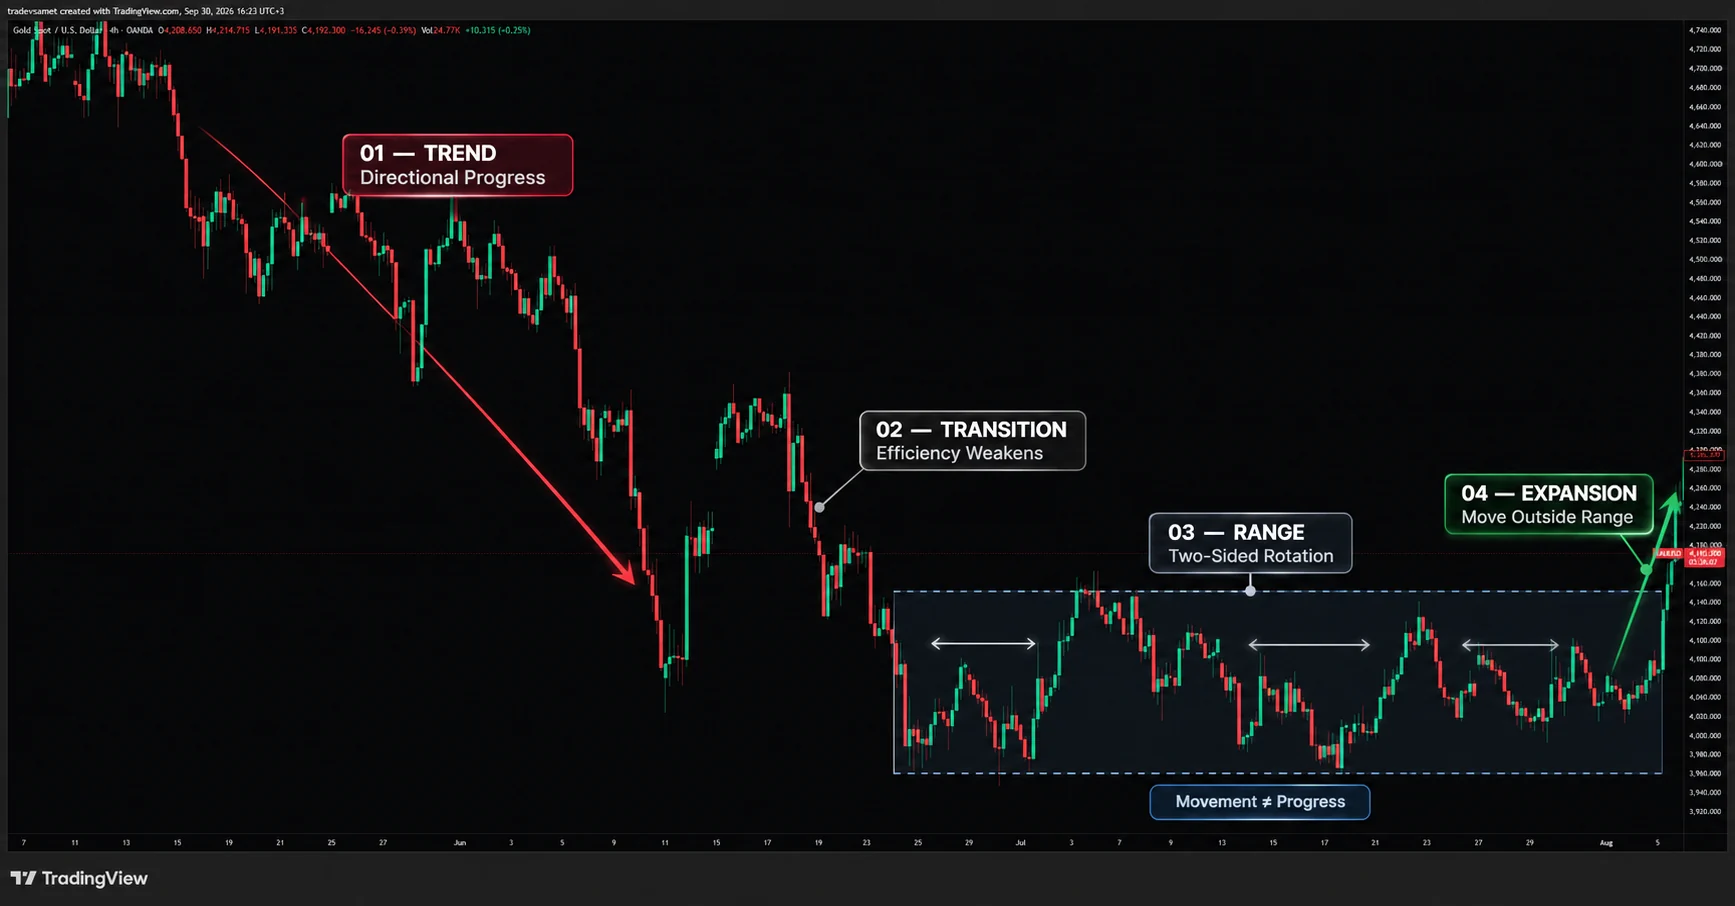
The chart above shows a real-market example of how market behavior can evolve across different conditions.
On the left, price displays sustained bearish directional progress.
As the sequence develops, directional efficiency begins to weaken, overlap increases, and price eventually transitions into a broader area of two-sided rotation.
At the far right, price begins expanding outside that range.
The important point is that these conditions are not permanent labels. Markets can transition from one environment to another.
1. What Is a Trending Market?
A trending market is one in which price makes sustained directional progress over a sequence of swings.
A bullish trend generally develops when price continues advancing upward through progressively higher areas.
A bearish trend develops when price continues progressing lower.
However, a trend should not be reduced to the idea that price simply moves in a straight line.
Real trends contain:
- Impulses
- Pullbacks
- Temporary consolidations
- Failed continuation attempts
- Changes in momentum
What makes the environment directional is not the absence of counter-moves.
It is the fact that, over time, one direction continues to produce more meaningful net progress than the other.
A useful way to think about this is:
A trend contains two-way movement, but one side produces greater directional progress.
In a bullish environment, sellers may still create strong downward candles and deep retracements.
But if price repeatedly resumes upward movement and continues extending the broader structure, bullish directional behavior remains dominant.
The opposite applies in a bearish environment.
Common Characteristics of a Trend
A trending environment may display:
- Repeated directional expansion
- Higher highs and higher lows in bullish conditions
- Lower highs and lower lows in bearish conditions
- Pullbacks that fail to reverse the larger directional sequence
- Relatively clear progression away from previous price areas
- Stronger follow-through after directional breaks
- Temporary consolidation followed by renewed expansion
None of these characteristics should be treated as a mechanical checklist.
Markets can trend cleanly or poorly. Some trends are smooth. Others are volatile, overlapping, and difficult to read.
Trend strength exists on a spectrum.
2. What Is a Ranging Market?
A ranging market is an environment in which price repeatedly rotates through a relatively contained area without producing sustained directional progress.
Instead of consistently moving away from previous prices, the market repeatedly revisits them.
A range often develops between a local upper boundary and lower boundary.
Price may move aggressively inside that area, but still fail to establish meaningful net progress beyond it.
This is an important distinction:
A ranging market does not necessarily mean a quiet market.
A range can contain:
- Large candles
- Strong short-term moves
- Volatility spikes
- Apparent breakouts
- Sharp reversals
The defining feature is not low activity.
The defining feature is that directional moves repeatedly fail to develop into sustained progression.
Price moves. But much of that movement is eventually retraced.
Common Characteristics of a Range
A ranging environment may display:
- Repeated interaction with similar price levels
- Increased overlap between swings
- Local upper and lower boundaries
- Failed attempts to continue beyond those boundaries
- Frequent direction changes
- Reduced net directional progress
- Movement back toward the center of the range
This creates a very different environment from a trend.
In a trend, pullbacks often occur inside a larger directional sequence.
Inside a range, what initially appears to be a new directional move may simply become another rotation toward the opposite side.
3. Directional Structure vs Sideways Structure
The difference between trend and range becomes clearer when we stop looking only at individual candles and start looking at the relationship between swings.
A directional structure continuously relocates price.
A sideways structure repeatedly returns price to a similar area.
Imagine two markets.
In the first market, price moves higher, pulls back, advances again, and then forms another higher area. Each cycle results in additional net progress.
In the second market, price rallies, declines, rallies again, and then falls back toward the same prices. The market may travel a considerable total distance, but its net displacement remains limited.
The key distinction is:
Directional structure creates progression. Sideways structure creates rotation.
This connects directly with the concept from Week 01:
Movement ≠ Progress
A market can move aggressively while still remaining range-bound.
4. A Trend Does Not Require Perfect Structure
One of the biggest mistakes when identifying market conditions is expecting trends to look like textbook diagrams.
Real markets rarely produce perfectly symmetrical sequences.
A bullish trend does not require every pullback to stop at exactly the same depth.
A bearish trend does not require every lower high to appear perfectly separated.
Markets can temporarily:
- Consolidate
- Produce overlapping candles
- Violate a minor swing
- Retrace deeply
- Accelerate
- Slow down
…and still remain directionally organized on the broader timeframe.
This is why market condition should be evaluated across a sequence rather than through one isolated event.
A single bearish candle does not destroy a bullish trend.
A single bullish candle does not end a bearish trend.
Likewise, one temporary consolidation does not automatically transform a trend into a range.
Context matters.
5. A Range Does Not Require Perfectly Horizontal Boundaries
Ranges are also frequently oversimplified.
Textbook diagrams often show perfectly horizontal support and resistance lines.
Real ranges are less precise. Their boundaries may be:
- Slightly rising
- Slightly falling
- Irregular
- Repeatedly overshot by wicks
- Temporarily broken before price returns inside
The important question is not: “Are the boundaries perfectly horizontal?”
A more useful question is: “Is price repeatedly returning to the same broad area instead of sustaining movement away from it?”
Ranges should therefore be treated as areas of balance rather than perfect geometric boxes.
6. Breakouts Behave Differently in Trends and Ranges
The surrounding market condition can significantly change how a breakout should be interpreted.
During a directional market, a break in the direction of the existing structure may become part of continued expansion.
Inside a range, however, price repeatedly interacts with the same boundaries.
A move beyond the edge of a range can therefore develop into several different outcomes:
- Genuine expansion
- Temporary breakout
- Liquidity sweep
- Rejection
- Failed breakout followed by rotation back inside
This is one reason why identifying the market condition first can improve chart interpretation.
The same visual event does not always carry the same meaning.
A break occurring within established directional structure is different from a break occurring after repeated two-sided rotation.
7. Why the Same Entry Logic Does Not Work Everywhere
This is one of the most important lessons of Week 02.
Many trading approaches are implicitly designed for a particular market environment.
For example, trend-following ideas generally depend on continued directional progression. These may include:
- Breakout continuation
- Pullback continuation
- Momentum entries
- Directional moving-average filters
Range-based approaches may instead focus more heavily on:
- Rejection near boundaries
- Failed breaks
- Rotation back toward the range
- Mean-reversion behavior
Neither category is universally superior.
The problem appears when an approach is used without considering the environment it depends on.
Consider a breakout setup.
During a strongly directional market, continued expansion may provide an environment in which the breakout develops into further directional progress.
Inside a mature range, however, price may move beyond a boundary and then return inside.
The visual setup can appear similar. The environment is different. Therefore, the outcome can also be different.
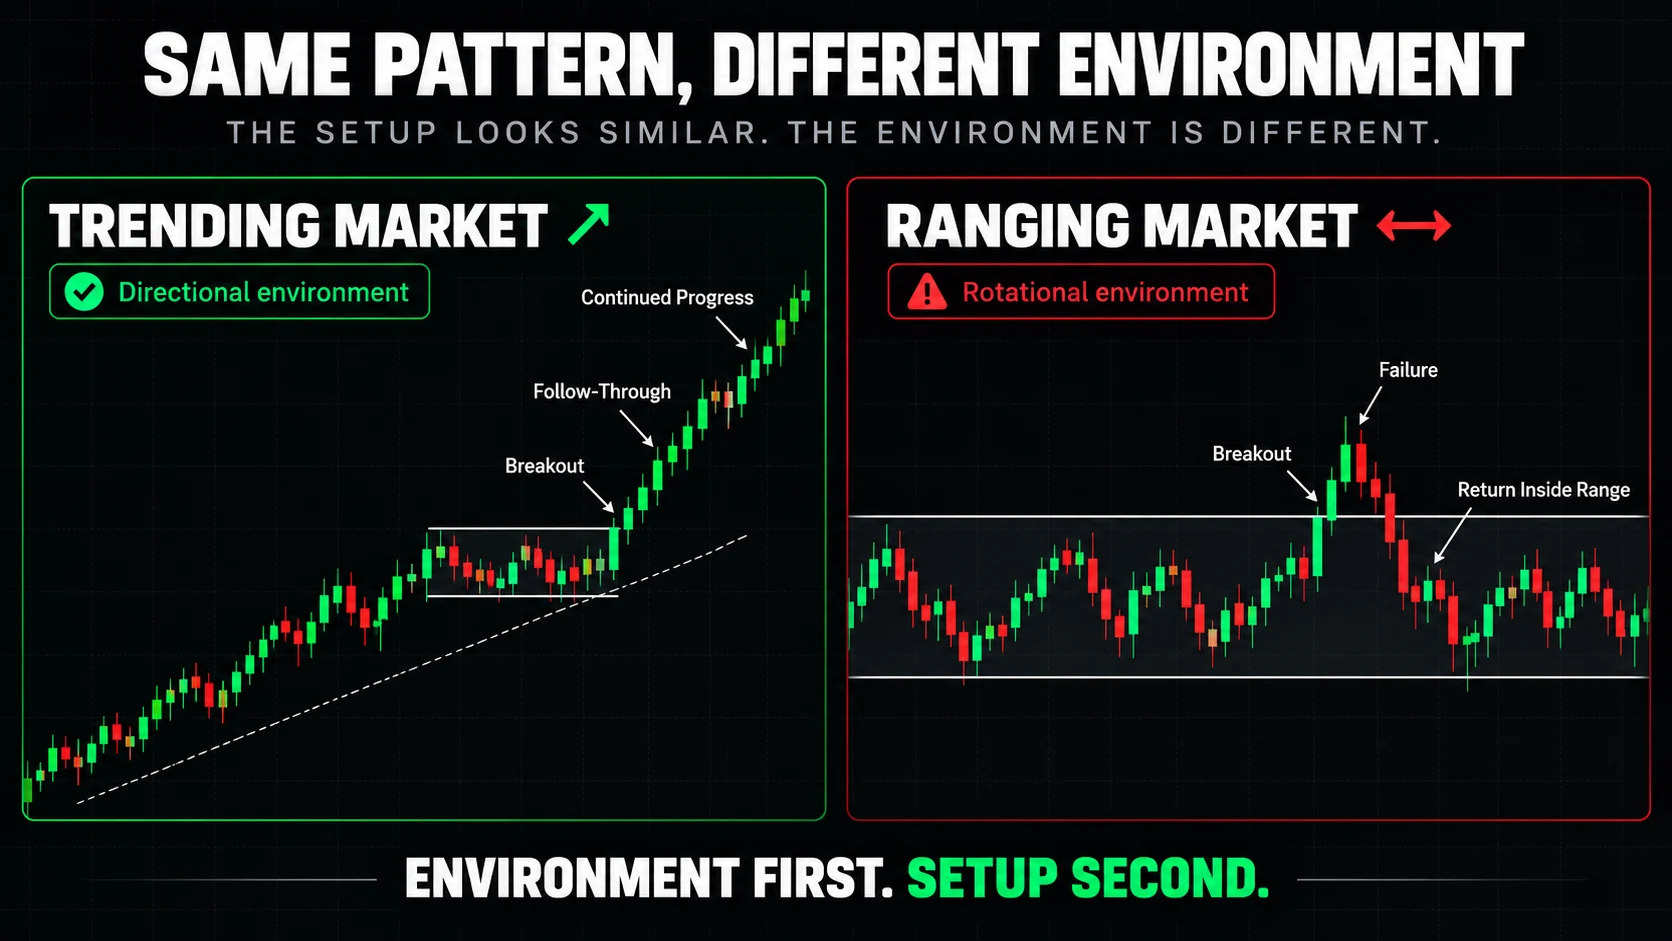
The comparison above illustrates this difference.
On the left, a breakout occurs inside an already directional environment. Price breaks the local area, produces follow-through, and continues making directional progress.
On the right, price breaks above a range boundary but fails to sustain that movement. The breakout is followed by rejection and a return into the previous range.
The key lesson is not that every trending-market breakout will continue or that every range breakout will fail. Neither outcome is guaranteed.
The lesson is that market environment changes the context in which the setup appears.
This leads to one of the central principles of Week 02:
Environment first. Setup second.
8. Trending and Ranging Are Not Binary States
It is tempting to classify every chart as either trend or range.
Real markets are not always that simple. There are transitional environments.
Price can move from:
- Range → Expansion → Trend
- Trend → Contraction → Range
- Trend → Deep correction → Reversal
There may also be periods where the market condition is genuinely unclear.
This matters because forcing a classification can create false confidence.
Market conditions exist on a spectrum. A chart can be:
- Strongly directional
- Moderately directional
- Weakly directional
- Transitional
- Loosely balanced
- Tightly ranging
The goal is not to create a perfect label.
The goal is to understand the dominant behavior currently visible.
9. The Role of Expansion and Contraction
Week 01 introduced the idea of expansion and contraction.
These concepts become especially useful when distinguishing trending and ranging markets.
During a trend, directional expansion often travels farther than the counter-directional contraction. For example:
- Expansion upward → Smaller pullback → Expansion upward
Over time, this creates net directional progress.
A range behaves differently. Directional moves occur, but expansion repeatedly fails to create lasting displacement.
Price may move:
- Up → Down → Up → Down
…while remaining inside approximately the same larger area.
This means that one useful question is:
Does each expansion relocate price, or does price keep returning to where it started?
That question often reveals more than simply counting bullish and bearish candles.
10. How to Identify the Market Condition in Real Time
Rather than relying on one indicator or rigid formula, begin with observational questions.
Question 1 — Is Price Making Net Directional Progress?
Compare the current price area with previous swings.
Is price consistently relocating higher or lower? Or does it repeatedly return to similar prices?
Persistent relocation supports a directional interpretation. Repeated return supports a ranging interpretation.
Question 2 — What Happens After Pullbacks?
In a trend, pullbacks may remain temporary and be followed by renewed directional expansion.
Inside a range, directional moves frequently fail to produce lasting follow-through.
Observe what happens after the market moves against the most recent leg. Does the previous direction resume? Or does price simply rotate again?
Question 3 — Are Swings Progressing or Overlapping?
Directional markets often produce swings that extend progressively away from previous areas.
Ranging markets typically show greater overlap between successive swings.
The greater the overlap, the less efficiently price is progressing.
Question 4 — Are Breaks Producing Follow-Through?
A break itself is not enough. Observe what happens afterward.
Does price accept and continue beyond the broken area? Or does it quickly return?
Repeated failed continuation can indicate that the environment is more balanced than directional.
Question 5 — Are Local Boundaries Becoming Important?
If price repeatedly reacts around similar upper and lower areas, a range may be developing.
The more often the market rotates between these areas without sustained escape, the more relevant the range structure becomes.
Question 6 — What Timeframe Am I Reading?
This question remains essential.
A market can trend on one timeframe while ranging on another.
Always define the timeframe before describing the market condition.
11. Timeframe Changes the Answer
Imagine price moving sideways on a four-hour chart.
Inside that four-hour range, a fifteen-minute chart may contain several clear bullish and bearish trends.
Likewise, a strong five-minute uptrend may represent nothing more than a small upward rotation inside a larger daily range.
This creates one of the most common sources of confusion in market analysis.
Two traders can look at the same instrument and describe different conditions while both being correct. They may simply be observing different timeframes.
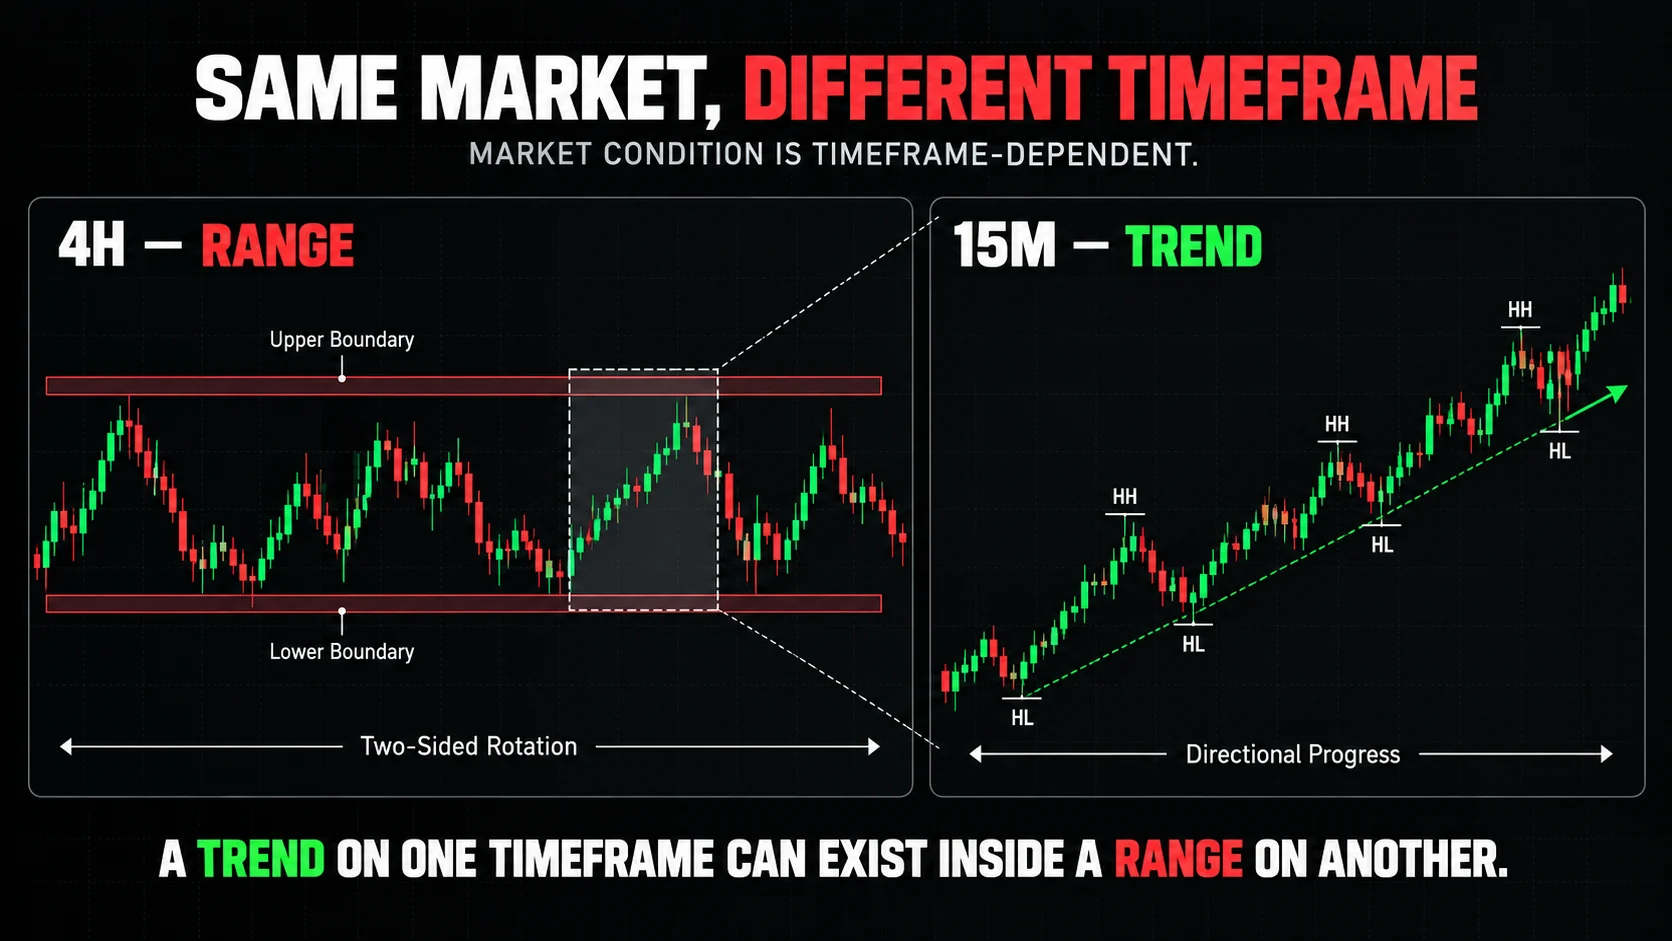
The comparison above shows the same basic idea visually.
On the higher timeframe, price is rotating between broad upper and lower boundaries. From that perspective, the market is range-bound.
However, when a smaller portion of that movement is viewed on a lower timeframe, the internal structure can display:
- Higher highs
- Higher lows
- Directional expansion
- Clear short-term progression
This leads to an important principle:
A trend on one timeframe can exist inside a range on another.
Instead of saying: “The market is ranging.”
A more precise statement would be: “Price is currently displaying range-like behavior on the four-hour timeframe.”
That additional context keeps the analysis tied to its observational perspective.
12. Market Conditions Can Change
Trend and range should not be treated as permanent labels.
A trending market can lose directional efficiency:
- Pullbacks may become deeper.
- Expansion may weaken.
- Swing overlap may increase.
Eventually, the environment may transition into consolidation or a broader range.
A ranging market can also change. Price may leave the established area, sustain movement outside it, and begin creating directional structure.
The transition itself is important.
Instead of only asking: “Is this a trend or a range?”
also ask: “Is the current behavior becoming more directional or less directional?”
Changes in market behavior can sometimes provide more useful information than a static label.
13. Common Mistakes
1. Calling Every Strong Move a Trend
A strong impulse can occur inside a larger range. One directional move does not automatically create a trending market.
2. Assuming a Range Must Have Perfect Boundaries
Real ranges are often irregular. Price can temporarily move beyond the local extremes and still return to balance.
3. Using One Entry Method in Every Condition
A setup designed around directional continuation may behave differently during repeated two-sided rotation. Market condition matters.
4. Ignoring Follow-Through
A breakout without sustained continuation may communicate something very different from a breakout followed by strong expansion.
5. Classifying the Market From One or Two Candles
Market condition is a property of a sequence, not an isolated candle.
6. Ignoring Timeframe
Trend and range classifications are timeframe-dependent.
7. Forcing a Label During Transitions
Sometimes the market is moving between conditions. Uncertainty is a valid observation.
14. Limitations
Trending and ranging markets are descriptive frameworks. They are not mechanical trading signals.
There is no universal threshold that perfectly separates one condition from the other.
Classification can depend on:
- Timeframe
- Volatility
- Instrument characteristics
- Market session
- Swing definition
- Visible chart history
- The amount of overlap considered meaningful
Their boundaries are not always exact. Different traders can reasonably classify transitional market behavior differently.
Most importantly, identifying a market condition does not reveal the future with certainty:
- A trend can reverse.
- A range can break.
- A breakout can fail.
- A pullback can develop into a larger structural change.
For that reason, market-condition analysis should not be treated as a prediction tool or mechanical entry signal.
Its purpose is to provide context.
Key Takeaways
Market behavior can be easier to interpret when the environment is identified before individual setups are evaluated.
- A trending market produces sustained directional progress over a sequence.
- A ranging market repeatedly rotates through a relatively contained area with limited net directional progress.
- A trend can contain pullbacks and consolidations.
- A range can contain large candles and strong short-term moves.
- The key difference is not simply movement, but whether that movement creates lasting directional progress.
- Breakouts can behave differently depending on the surrounding market condition.
- Trend and range classifications are timeframe-dependent.
- Market conditions can transition gradually rather than changing instantly.
Most importantly:
Environment first. Setup second.
Before evaluating what a pattern might mean, first understand the environment in which that pattern is developing.
That simple change in perspective can make price action easier to describe, compare, and study.
Anti-Chop Filter Pro
Most losing trades aren't bad entries. They're good entries taken in a market that was never tradeable.
PRO+Structure Sync Entry Engine
Most losing entries were technically correct. They were just taken while the higher timeframes disagreed.
PRO+Trend Scalper Entry
A colour change is not a trend. It is a colour change.